FAO Food Price Index
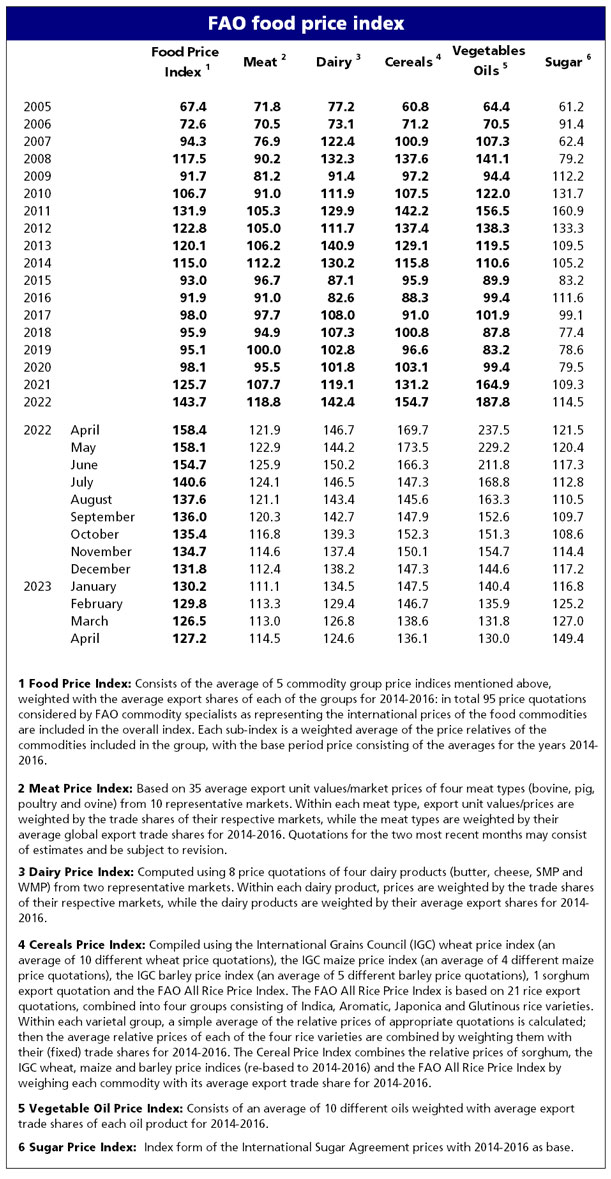
The FAO Food Price Index (FFPI) is a measure of the monthly change in international prices of a basket of food commodities. It consists of the average of five commodity group price indices weighted by the average export shares of each of the groups over 2014-2016. A feature article published in the June 2020 edition of the Food Outlook presents the revision of the base period for the calculation of the FFPI and the expansion of its price coverage, to be introduced from July 2020. A November 2013 article contains technical background on the previous construction of the FFPI.
Monthly release dates for 2023: 6 January, 3 February, 3 March, 7 April, 5 May, 2 June, 7 July, 4 August, 8 September, 6 October, 3 November, 8 December.
FAO Food Price Index drops in August, reversing the slight rebound of the previous month
Release date: 08/09/2023
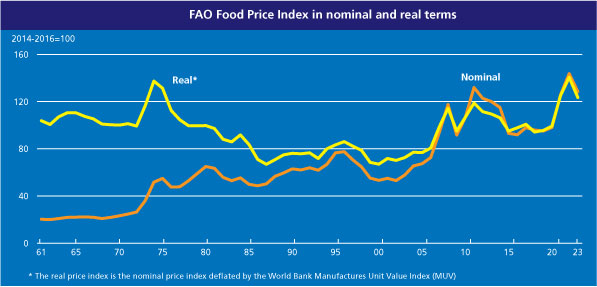
» The FAO Food Price Index* (FFPI) averaged 121.4 points in August 2023, down 2.6 points (2.1 percent) from July, reversing the rebound registered last month and pushing the index as much as 38.3 points (24.0 percent) below its peak reached in March 2022. The drop reflected declines in the price indices for dairy products, vegetable oils, meat and cereals, while the sugar price index increased moderately.
» The FAO Sugar Price Index averaged 148.2 points in August, up 1.9 points (1.3 percent) from July and as much as 37.7 points (34.1 percent) from its level in the same month last year. The increase in world sugar prices was mainly triggered by heightened concerns over the impact of the El Niño weather phenomenon on global production prospects. In India, below-average rains in August were detrimental to sugarcane crop development, while persistent dry weather conditions in
Thailand are expected to negatively affect the 2023/24 sugar production. In Brazil, rains hampered field operations in some areas; however, the large crop currently being harvested limited the upward pressure on world sugar prices. The weakening of the